Logan Economic Analysis 2022/23

Logan City Council collects key economic statistics and information to measure how the city is performing. This information has been compiled into the 2022/23 Economic Analysis Report. Most of the data is from the end June 2023 reporting period, but is noted if the data set contains data from different time periods. Links to relevant data sources are included where possible.

Key Economic Indicators

Gross Regional Product (GRP)

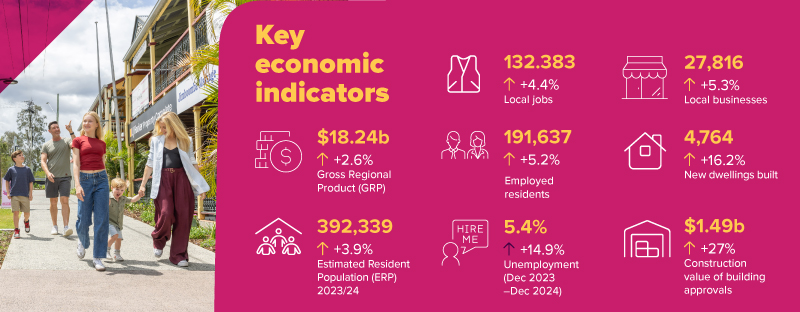
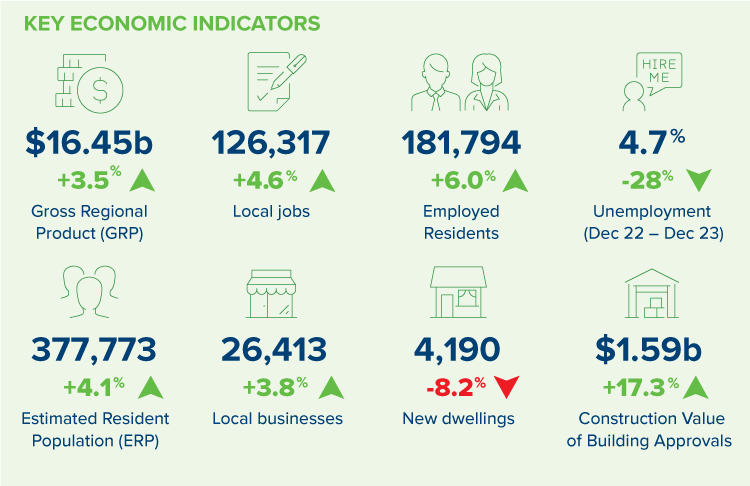
The City of Logan’s Gross Regional Product (GRP) at June 2023 was $16.45 billion, an increase of 3.5% since June 2022.

Growth has moderated since the post-COVID surge, but is still higher than the state average of 2.4%. Additionally the City of Logan’s GRP as a percentage of Gross State Product is the highest it has ever been at 3.54%.

Growth in Logan is being driven by construction, manufacturing, and health care and social assistance industries.

Year (ending 30 June) GRP ($m) % change from previous year
2023 16,449 +3.48
2022 15,896 +6.13
2021 14,979 +7.43
2020 13,943 -1.50
2019 14,155 +1.99

Industry

Construction continues to be the biggest industry in the city by economic output, generating $6.7 billion in 2022/23 – however output has fallen by $415 million from June 22 (adjusted for inflation). Manufacturing has also seen a reduction in output, as has the Retail Trade sector and Public Administration and Safety.

Top industries by output

  • Construction – $6.7 billion (-$415 million from 2021/22)
  • Manufacturing – $4.18 billion (-$97 million)
  • Health Care and Social Assistance – $2.65 billion (+$230 million)
  • Transport, Postal and Warehousing – $2.01 billion (+$112 million)

Three industries saw a reduction of output in the 12 months to June 2023

  • Manufacturing: $4.18 billion (-$97 million)
  • Public Administration and Safety: $1.01 billion (-$21 million)
  • Retail Trade: $1.59 billion (-$8 million)

The top performing industries over the last 5 years are

  • Manufacturing: +$2.33 billion
  • Health Care and Social Assistance: +$915 million
  • Rental, Hiring and Real Estate Services: +$389 million
  • Transport, Postal and Warehousing: +$266 million
  • Public Administration and Safety: +$244 million

Retail Trade is the only industry with a lower output figure than 2018, down $18 million over the 5-year period, which is only 1%.

Manufacturing is the city’s biggest exporter with a value of $1.96 billion. Food Manufacturing, Primary Metal and Metal Product Manufacturing, Fabricated Metal Product Manufacturing, Petroleum and Coal Product Manufacturing, and Polymer Product and Rubber Product Manufacturing make up the majority of this industry.

Employment

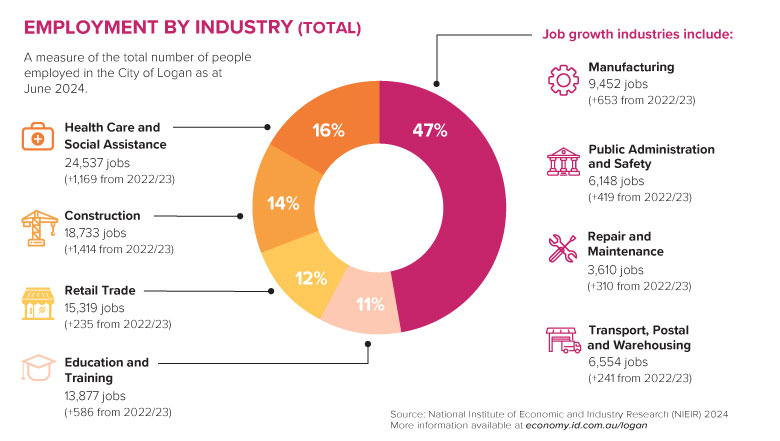
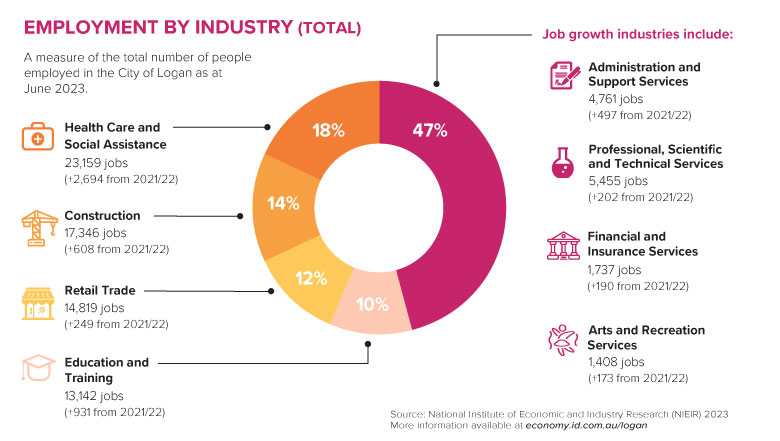
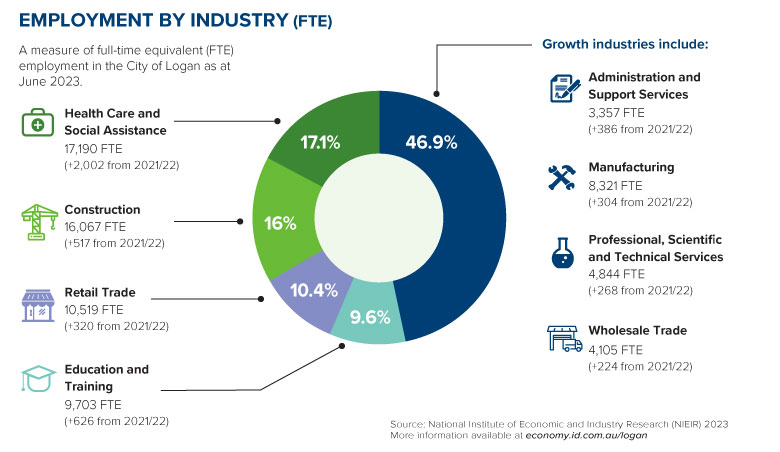
The top employing industries as at June 2023

  • Health Care and Social Assistance – 23,159 jobs (+2,694 from 2021/22)
  • Construction – 17,346 jobs (+608)
  • Retail Trade – 14,819 jobs (+249)
  • Education and Training – 13,142 jobs (+931)

Local Jobs

There were 126,317 jobs located in the City of Logan in the year ending June 2023. This represents a 4.6% increase from 120,729 jobs at June 2022.

Logan has recorded strong local jobs growth of 14.8% from June 2018 to June 2023. Local jobs growth has cooled from its all-time high of 6.32% in 2022, down to 4.63% in June, but is still above the Queensland average of 3.66%.

Year (ending 30 June) Local jobs % change from previous year
2023 126,317 +4.63
2022 120,729 +6.32
2021 113,551 +2.67
2020 110,599 -1.04
2019 111,756 +1.55

The 2021 Census data showed that for the 102,853 local jobs in the city, 59% of those were occupied by Logan residents. The other 41% of workers live in other Council areas and commute into the city for work. Main residential locations include Brisbane (20.4%), Gold Coast (8.7%), Redland (4.2%) and Ipswich (3.6%).

Local workers

Of the 151,633 employed Logan residents in the 2021 Census data, 40% live and work in the City of Logan, 54.1% travel outside the city for work, and 5.9% have no fixed place of work. Brisbane was the main employment centre, with 57,120 (37.7%) Logan residents travelling to the Brisbane Council area for work.

Employed locals

There were 181,794 Logan residents in employment at June 2023. This is a 6% increase from 171,502 from June 2022.

Unemployment (Dec 2023 data)

The unemployment rate has been trending downwards since September 2021 and is 4.7% for the December 2023 quarter, the lowest it has been for at least 10 years.

Unemployment Rate % Change in % points
Period: Quarter Dec-22 Mar-23 Jun-23 Sep-23 Dec-23 Dec 22 to Dec 23
Australia 3.7% 3.6% 3.5% 3.6% 3.7% 0%
Queensland 3.9% 3.8% 3.7% 3.8% 4.0% 4%
Brisbane 3.2% 3.1% 3.1% 3.4% 3.5% 9%
Gold Coast 2.9% 2.3% 2.8% 3.0% 3.3% 12%
Moreton Bay 4.1% 4.1% 4.1% 4.5% 5.2% 21%
Redland 2.3% 2.2% 2.8% 3.6% 3.9% 41%
Ipswich 6.4% 6.5% 5.9% 4.8% 4.5% -42%
City of Logan 6.5% 6.4% 5.7% 4.9% 4.7% -38%

Areas with the lowest unemployment rate

  • Cornubia – Carbrook – 1.4%
  • Shailer Park – 1.7%
  • Wolffedene – Bahrs Scrub – 2.0%
  • Rochdale South – Priestdale – 2.1%
  • Springwood – 2.1%
  • Daisy Hill – 2.2%
  • Logan Village – 2.3%

Areas with the highest unemployment rate

  • Logan Central – 16.5%
  • Woodridge – 15.9%
  • Kingston – 14.1%
  • Loganlea – 8.4%
  • Slacks Creek – 8.3%

Areas with most improved unemployment rate over the last 12 months

  • Springwood (3.6% to 2.1%) -71%
  • Mount Warren Park (5.5% to 3.3%) -67%
  • Cornubia – Carbrook (2.3% to 1.4%) -64%
  • Underwood (3.9% to 2.5%) -56%
  • Loganholme – Tanah Merah (4.0% to 2.6%) -54%

The Youth Unemployment Rate for Logan – Beaudesert was 10.4% at April 2024. The youth unemployment rate started to drop during the 2022/23 financial year from 15.8% in June 2022 to 10.5% in June 2023. The rate has remained fairly stable during 2023/24 so far with the rate at its lowest in October 23 (8.5%) and travelling upward to 10.4% in April 2024.

Local Businesses

There was a net increase of 962 local businesses from June 2022 to June 2023, to 26,413 businesses. The highest amount of new businesses were in the Transport, Postal and Warehousing, Construction, and Healthcare and Social Assistance industries. 97.6% of businesses in Logan are sole traders or small businesses (less than 20 employees)

Number of businesses by turnover

  • Zero to less than $50k – 5,582
  • $50k to less than $200k – 9,716
  • $200k to less than $2m – 8,969
  • $2m to less than $5m – 1,084
  • $5m to less than $10m – 386
  • $10m or more – 376

Number of businesses by employment size

  • Non employing – 15,906
  • 1-4 employees – 7,559
  • 5-19 employees – 2,315
  • 20-199 employees – 606
  • 200+ employees – 27

Population

The Estimated Resident Population of the City of Logan is 377,773 as at June 2023. This is a 4.1% increase from 2021/22 and makes Logan the fastest growing LGA in Queensland. The 5-year average growth is 3.1%.

LGA Population 2022 Population 2023 Difference 2023-2022 % increase
City of Logan 363,059 377,773 14,714 4.1
Ipswich 242,640 251,148 8,508 3.5
Brisbane 128,3432 1,323,162 39,730 3.1
Gold Coast 647,178 666,087 18,909 2.9
Sunshine Coast 355,904 365,942 10,038 2.8
Moreton Bay 496,772 510,104 13,332 2.7
Scenic Rim 44,331 45,248 917 2.1
Redland 163,729 166,809 3,080 1.9

Estimated population growth is highest in the following SA2 areas

  • Chambers Flat – Logan Reserve – +18.4%
  • Greenbank – North Maclean – +12.9%
  • Boronia Heights – Park Ridge – +9.3%
  • Yarrabilba – +7.9%
  • Wolffdene – Bahrs Scrub – +7.7%

Brisbane, Gold Coast, Moreton Bay and Logan were the top 4 LGA’s for overseas migration. Logan had the highest amount of net internal migration in QLD and the 2nd highest nationally (more Australians are moving to Logan than any other Council area in Queensland, and 2nd nationally only behind Melton, VIC).

Logan has the 4th highest population density in QLD (behind Brisbane, Gold Coast and Weipa).

Development Activity Highlights

  • Estimated construction value of Building Completions in 2022/23 was $1.59 billion, up 17% from $1.35 billion in 2021/22.
  • 250,845m² of new non-residential Gross Floor Area (GFA) space completed in 2022/23 (excludes mixed use), which is a 8% decrease from 2021/22.
  • The biggest increases in non-residential growth occurred in Warehouse, Distribution & Logistics with 180,107m² of new floor space (GFA).
  • Estimated construction value of all new Building Approvals was $2.08 billion for 2022/23, up 10.8% from $1.87 billion in 2021/22.
  • Estimated construction value of new non-residential work (based on Building Approvals) is $401,045,389 (excludes mixed-use, demolitions, alterations and fit-outs).
  • Over 4,100 new dwellings have been added to the city’s housing stock (130,109 as at June 2022). This is a decrease from 4,500 dwellings added in 2021/22. Of these additional dwellings, the most popular dwelling type was a stand-alone house, followed by a house with a secondary dwelling/auxiliary unit.
  • The medium construction value for residential dwellings continue to increase with the median cost of a stand-alone house increasing to $355,760 in 2022/23 from $303,250 in 2021/22.
  • The average construction timeframes for residential dwellings continue to increase with a stand-alone home taking an average of 230 business days from approval to completion in 2022/23 which is an increase from 194 days in 2021/22.
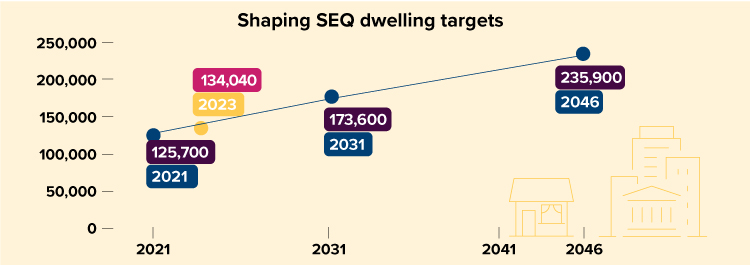
  • Logan is currently below our dwelling number targets that are set by the State Government’s SEQ Regional Plan. As at June 2023 the city has 134,040 dwellings moving towards 235,900 by 2046.

Top 5 suburbs for residential dwelling completions were

  • Logan Reserve – 959
  • Park Ridge – 546
  • Greenbank – 475
  • Yarrabilba – 281
  • Flagstone – 208

Census Comparison Data

To see changes to the City of Logan’s demographic data from the 2016 Census to the 2021 Census, see our fact sheet.

Sources

Australian Bureau of Statistics, Counts of Australian Businesses, including Entries and Exits, 2017 to 2023

Australian Bureau of Statistics, Estimated Resident Population (ERP) and components by Local Government Area 2017 to 2023

Economy.id industry structure and industry sector profiles use a National Accounts regional econometric model developed by National Institute of Economic and Industry Research (NIEIR) economy.id.com.au

Urban Research & Monitoring Unit, Economic Development and City Planning Branch, Logan City Council

Small Area Labour Markets Australia, Australian Government, Department of Employment, Skills, Small & Family Business, ABS State Details

Queensland Government Statistician’s Office – Regional youth unemployment

*Many of the datasets in this economic profile are underpinned by the NIEIR-ID economic model, which is updated each financial year. As benchmarks are changed every year, this can affect historical figures.

Hydromulch trial good to grow in Underwood Park

Textile recycling pioneers BlockTexx are not just breaking new ground in the City of Logan – they’re also helping to improve it.

The Loganholme-based ‘clean technology’ company is working with Logan City Council to trial a new type of mulch and seed mixture that could increase grass coverage at Underwood Park in Priestdale.

BlockTexx’s hydromulch – a blend of recycled cotton fibres, grass seed and fertiliser – is expected to promote turf growth by increasing nutrient levels in soil and helping to retain moisture.

If successful, the trial could also help create a new avenue for the recycling of cotton-based materials otherwise destined for landfill.

BlockTexx’s innovative textile recycling process chemically separates natural cotton fibres from synthetic polyester in items such as clothing and bedsheets.

The cotton is then reused in products like CellTexx – a cellulose clay that can be added to hydromulch or building materials. The raw polyester can also be reused.

City of Logan Mayor Jon Raven said Council was proud to support innovative local companies such as BlockTexx that are exploring new solutions to combat climate change and reduce waste in landfill.

“BlockTexx has quickly become a leader in the recycling industry, helping cement our city as the place where innovative ideas are born and grow,” Cr Raven said.

“Encouraging local businesses to explore new ideas is a priority for Council, especially when those ideas help reduce waste heading to landfill or create new revenue streams.

“This is the first technology in the world that breaks textiles down so they can be completely recycled – that’s good for our community, good for our economy and good for the environment.

“Our city’s future will be bright if we can encourage more businesses like this one to thrive here. After all, Logan is the perfect location for smart investors.”

BlockTexx co-founder Graham Ross said the company was delighted to work with Council to trial a new product with applications for the environment and local industry.

“Cotton breaks down to cellulose, which contains about 43 per cent embedded carbon and is the building block to plants and animals,” Mr Ross said.

“By combining that cellulose into a hydromulch mix of fertiliser, grass seed and water, we are effectively taking what nature grew in the first place and putting it back into nature.

“(This method) is incredibly important not only for our environment, but also for product development. Recycling is one thing, but resource recovery – that’s the future.”

The hydromulch was applied to a section of ground in the dog-off leash area at Underwood Park in late March.

Another section was reserved for Council’s regular turf growth procedure, so results could be compared.

Almost four weeks later, a thick layer of grass now covers the hydromulch site which looks considerably healthier than the comparison grass patch.

BlockTexx scientists have also recorded higher levels of moisture retention in their patch.

Final results from the trial are expected in late May.


Logan Office of Economic Development was proud to have facilitated the BlockTexx hydromulch trial with Logan City Council. Our team had the knowledge and networks to make the right connections and get the project off the ground.

We’re committed to helping businesses in emerging and circular economy industries grow, as this leads to better economic outcomes for the city and more high-value jobs.

We support businesses at all stages of their journey, from initial investment to expanding through new opportunities.

Another leg completed in race to deliver legacy venue

Logan City Council has taken the next critical step towards securing a multi-purpose community venue to support the City of Logan through to the 2032 Olympic and Paralympic Games, and beyond.

Councillors this week made the decision to support the preliminary design for the large-scale facility to move forward.

The design will form part of the official business case which will be considered by the Queensland and Australian Governments later in the year for an investment decision.

The design emphasises the city’s need for a broad-scale facility that can support a wide range of community activities including sports training and official competitions, conferences, exhibitions and corporate events.

Council also committed to providing in-principle funding for the required multi-purpose venue enhancements, as part of its 2025/26 Budget process.

Mayor Jon Raven said Council was determined to aim high to secure a venue with the potential to catapult the City of Logan into the future.

“It’s no secret that our city has Olympic-sized dreams for its future, but those dreams extend well beyond the 2032 Games,” Cr Raven said.

“We’ve been working collaboratively with the state and federal governments to get the best outcome for the city.

“Getting the design of this major new venue right will give our athletes, community groups and businesses more chances to succeed – and give everyone else another reason to visit the City of Logan.

“Today, we are showing the other levels of government that we’re serious about co-investing to build something that will have a long-term legacy.

Rhythmic gymnasts at Gymnastics Qld Senior State Championships

“As the fastest-growing city in Queensland and with a young and diverse population of up-and-coming athletes, it’s vital our future venues cater to the expanding aspirations of our community.”

The delivery of the new multi-purpose venue is among several strategies Council is advocating for to capitalise on the hosting of the 2032 Olympic and Paralympic Games in South East Queensland.

Council’s 2032 City of Logan Legacy Roadmap outlines 19 key initiatives designed to:

  • secure new facilities and infrastructure
  • stimulate economic growth
  • promote active living and participation in sport
  • leverage multicultural roots within the local community.

The new venue, subject to the investment decision required under the Intergovernmental Agreement between the state and federal governments, is also expected to kickstart urban renewal in locations across the city by encouraging greater investment to stimulate economic growth and helping Council advocate for the development of more short-term accommodation.


Logan is the fastest growing local government area in Queensland

The City of Logan is on an upward growth trajectory, with the latest ABS figures showing the city is the fastest growing local government area (LGA) in Queensland.

According to the Australian Bureau of Statistics, the Estimated Resident Population for the City of Logan at June 2023 is 377,773, an increase of 4.1% from June 2022. That’s an extra 14,714 people calling the City of Logan home in 2023.

Local Government AreaERP at 30 June 2022ERP at June 2023ERP Change 2022-23ERP change %
Logan363,059377,77314,7144.1%
Ipswich242,640251,1488,5083.5%
Brisbane1,283,4321,323,16239,7303.1%
Gold Coast647,178666,08718,9092.9%
Sunshine Coast355,904365,94210,0382.8%
Moreton Bay496,772510,10413,3322.7%

The 5-year average population growth of the city is 2.88%, noting lower growth years in 2020 and 2021 due to the covid-19 pandemic.

Chart - annual change in estimates resident population

The top 10 growth areas in Logan are

  • Chambers Flat / Logan Reserve (+18%)
  • Greenbank / North Maclean (+13%)
  • Boronia Heights / Park Ridge (+9%)
  • Yarrabilba (+8%)
  • Wolffdene / Bahrs Scrub (+8%)
  • Flagstone (West) / New Beith (+5.7%
  • Edens Landing / Holmview (+5.2%)
  • Browns Plains (+4.1%)
  • Logan Village (+3.4%)
  • Waterford West (+3.4%)

Brisbane, Gold Coast and Logan were the top 3 LGA’s for overseas migration

Logan has the 4th highest population density in QLD (behind Brisbane, Gold Coast and Weipa)

More on the menu for Croydon Road

The delights and delicacies of Logan Central’s popular Croydon Road food precinct will soon be sampled like never before.

Works have begun on a major streetscape upgrade to support local business, improve pedestrian and cyclist access and beautify the area.

The Croydon Road precinct, opposite the Woodridge Train Station, is home to a wide range of food and grocery outlets featuring cuisines from across the globe.

The area also hosts Logan Central’s Global Food Markets each Sunday.

The bustling multicultural event regularly attracts hundreds of people seeking exotic fruits and vegetables and authentic street foods.

Upgrade works will add to the area’s existing appeal.

Council’s Croydon Road Streetscape Upgrade is designed to add a bit more flavour to one of the city’s most popular food hubs.

Improved access, new landscaping and public seating will encourage even more people to come and taste everything it has to offer.

New lighting and CCTV cameras will improve the safety of the area.

A public toilet block, shelters and bins will also be installed as part of project works.

Council has worked closely with local businesses and community members, and are proud to be delivering a streetscape upgrade for Croydon Road that will entice businesses and consumers alike.

The project is jointly funded by Logan City Council and the Queensland Government’s 2021–24 South East Queensland Community Stimulus Program.

Queensland Treasurer and Woodridge MP Cameron Dick said the project was tailored to support the local business community.

“We’re doing this to support all of these hard-working business people, who want to get ahead and who want their kids to get ahead,” Mr Dick said.

“This is a great partnership between Local Government and State Government to make a community better.”

Pedestrian and cycle access through Croydon Road will be maintained during construction works.

Alternate parking will be arranged off Railway Parade and Blackwood Road, for Global Food Market attendees on Sundays.

Drivers should follow signs in the area.

For more information about the upgrade, visit Have your say – Croydon Road precinct.

Jobs Expo provides career pathways

City of Logan job seekers can lay the foundations for future careers at the annual Logan Jobs Expo this week.

The free event connects those looking for work with local businesses that provide employment, training and apprenticeship opportunities in the construction, manufacturing and trade industries.

The 2023 Logan Jobs Expo is at Logan Metro Sports & Events Centre, 357 Browns Plains Road at Crestmead from 9 am until 2 pm on Thursday, September 14.

Last year’s Expo attracted more than 800 attendees and saw 17 people secure local employment on the day.

This year’s event is expected to attract more than 70 exhibitors.

The Jobs Expo is another initiative of the Mayor’s Local Jobs and Skills Taskforce, which helped 213 people – including 58 youth – find employment in the 2022/23 financial year.

Mayor Darren Power said it would help job seekers of all ages prepare for success.

“Our taskforce was launched in 2021 to empower local job seekers to unleash their potential and take control of their employment journey,” Cr Power said.

Economic Development Chair, Cr Jon Raven said the Expo supports local businesses seeking employment-ready staff.

“We know that growing businesses need good staff to provide great service, which is why we want to help Logan businesses find local staff who are ready to work,” Cr Raven said.

Division 8 Councillor Jacob Heremaia said the Jobs Expo caters for all ages.

“Whether you are a school-leaver, or looking for a career change, there will be plenty of advice and options available,” Cr Heremaia said.

Job seekers can register their attendance at Logan Jobs Expo.


Time to share our brightest visions for city’s golden future

When the eyes of the world turn to South East Queensland for the 2032 Olympic and Paralympic Games, it won’t be just the City of Logan’s sports stars shining bright.

Logan City Council has outlined a plan to help residents, businesses and organisations put their best foot forward, and make the most of the opportunities the Games will bring to the city.

Now, Council wants to hear the community’s best and boldest ideas.

The 2032 City of Logan Legacy Roadmap – including 19 initiatives to set up the city for success – will be released for public consultation on Monday, September 4.

Interested locals will be able to provide their feedback on the plan via Council’s Have Your Say platform, at: haveyoursaylogan.com.au.

Mayor Darren Power said having the world’s biggest sporting event in the city’s backyard was a once-in-a-lifetime opportunity.

“Our city is perfectly positioned to support and supply the Games, and has talent, experience and cultural advantages,” Councillor Power said.

“Council’s draft Roadmap is a fantastic starting point, but we know we aren’t the only ones with an Olympic-sized passion for the future of our city.

“We want to hear from everyone with ideas on how we can position ourselves for success.”

The 2032 City of Logan Legacy Roadmap focuses on Council’s vision for:

  • the delivery of new community facilities and infrastructure
  • stimulating economic growth
  • improving the health of Logan residents
  • leveraging the cultural diversity of the local community.

The Have Your Say survey is the first of many community engagement opportunities planned ahead of the 2032 Olympic and Paralympic Games.

Survey participants will be able to contribute their own ideas, and indicate their support for those posed by others.

The survey will close on Monday, October 2.


Logan Plan 2025 – Blueprint for the city

Options to create more housing choices, along with a range of policy decisions to manage unprecedented local growth, are key platforms of the new draft Logan Plan 2025, endorsed today for submission to the State Government for their review.

Terrace housing is proposed for the first time as Council looks for different ways to achieve increased density in appropriate locations without the overhead of body corporate fees which apply to most townhouses and unit blocks.

Logan Plan 2025 (LP25), once finalised, will build on what is working well from the current planning scheme (Logan Planning Scheme 2015) as it guides city growth over the next 20 years.

The proposed new policy decisions aim to enhance the liveability, amenity and function of the city, which is one of the fastest-growing areas in South East Queensland.

Proposed changes include:

  • Promoting high-quality urban design with stronger guidance for subdivisions, apartments, landscaping, urban greening and streetscaping
  • Providing appropriate employment land where new businesses or industries can be established, and existing ones can grow
  • Prioritising more housing choices near public transport and major commercial centres
  • Protecting the city’s heritage by clarifying criteria relating to the preservation and use of places of historical and cultural significance
  • Introducing a new tourism code to provide confidence for investors, operators and residents to enable appropriate and economy-boosting experiences in the city

Council also aims to flick the switch on a bustling night-time economy to give residents more local entertainment options after 6pm while putting the brakes on the impacts of service stations on surrounding areas and nearby shopping centres.

City of Logan Mayor Darren Power said LP25 was essential to manage a future where the local population is projected to surge past 500,000 in the next decade and reach more than 600,000 by 2046.

“New residents are coming in droves to live in our great city, and we need to have a robust, well-balanced Planning Scheme to best manage the serious growth we have ahead of us,” Cr Power said.

“We want to ensure we have quality, well-designed development in the right areas, and in a way which reflects the values of our community.”

Planning Chair, Cr Jon Raven, said the draft LP25 introduced improvements on the previous planning scheme that would better serve the community and local lifestyles.

The new policy positions were shaped by input from the community, Councillors, specialist consultants, the development industry and university researchers.

“We already live in a fantastic city, but we want to make it even better,” Cr Raven said.

“We need to plan for the future so that our residents can benefit from the growth we’re experiencing over the next decade.”

The draft LP25 will now be submitted to the Queensland Government for a mandatory state interest review.

Once that review is completed, Council will share the draft LP25 with the community for consultation. Council will use that feedback to further improve the plan.

A final Queensland Government review follows, before the plan is expected to be adopted in late 2025.

Visit the Logan Plan 2025 Online Portal for more information.

Congratulations to Logan Business Distinction Awards 2023 winners

Last week the Logan Chamber of Commerce hosted their 2023 Business Distinction Awards, supported by Diamond Sponsors Logan City Council and Bendigo Bank.

Held at Logan Entertainment Centre, it was a fantastic opportunity to congratulate and celebrate businesses in the City of Logan.

This year, there were 19 industry categories for businesses to nominate for and 6 major awards, and 2 Business of the Year awards.

2023 Major Award Winners

  • Large Business of the Year – Munster Services
  • Small Business of the Year – Bee All Natural
  • Services to the Community – DMH Realty
  • Accessibility and Inclusiveness – Munster Services, TechPath Pty Ltd
  • Environmental Conscientiousness & Sustainability – Munster Services
  • New and Emerging Business – Adopt a Beehive
  • Most Innovative Business – B&C Plastics
  • Woman Led Business – Bee All Natural

2023 Industry Category Winners

  • Automotive and Transport – Wheelnutz Garage
  • Beauty, Health and Wellbeing – Hedz Up Hair and Beauty
  • Building, Construction, and Real Estate – DMH Realty
  • Business-to-Business Services (Large) – TechPath Pty Ltd
  • Business to Business Services (Small) – Speech Perfect
  • Creative Industries – The Flower Crew Originals
  • Charity and non for profit (Large) – Able Australia
  • Charity and non for profit (Small) – YMCA Schools Breakfast Program
  • Health and Wellbeing – Bee All Natural
  • Home Services – Laser Tag in a Box
  • Hospitality and Events – Simply Beans Coffee Roast Specialists
  • Manufacturing and Production – Munster Services
  • Media and Advertising (Large) – Rebel Media
  • Media and Advertising (Small) – Obsidian Marketing
  • Medical and Vet Services – Choice Dental Browns Plains
  • Professional Services – Cornerstone Law Offices
  • Retail – Simply Beans Coffee Roast Specialists
  • Technology – TechPath Pty Ltd
  • Trade Services – Munster Services
  • Tourism – Hello World Travel Rochedale Shopping Village
  • Encouragement Award – Stick Mob

See the photos HERE.

Logan Office of Economic Development and Logan City Council proudly support the Logan Business Distinction Awards. We have engaged and supported most of the winners and nominees through their business journey, and would like to congratulate their success.

Logan Economic Analysis 2021/22

Logan City Council collects key economic statistics and information to measure how the city is performing. This information has been compiled into the 2021/22 Economic Analysis Report. Most of the data is from the end June 2022 reporting period, but is noted if the data set contains data from different time periods. Links to relevant data sources are included where possible. View the summary pdf.

Key Economic Indicators

Economic Data Key Indicators

Gross Regional Product (GRP)

The City of Logan has continued its strong growth coming out of COVID-19 with 2-year average growth in GRP at 5.25%. GRP has increased 12.1% in the five years since June 2017 and is now over $15 billion.

Growth in Logan is being driven by construction, health care and social assistance, and administrative and support services industries.

Year (ending 30 June) GRP ($m) % change from previous year
2022 15,023 +4.60
2021 14,362 +5.89
2020 13,564 -1.02
2019 13,703 +2.27
2018 13,398 +5.82

Industry

Construction continues to be the biggest industry in the city by economic output, generating $5.9 billion in 2021/22 – an increase of $791 million from 2020/21.

Top industries by output

  • Construction – $5.90 billion (+$791 million from 2020/21)
  • Manufacturing – $3.68 billion (-$61 million)
  • Health Care and Social Assistance – $2.19 billion (+$180 million)
  • Transport, Postal and Warehousing – $1.88 billion (+$100 million)

Five industries saw a reduction of output in the 12 months to June 2022:

  • Manufacturing – $3.68 billion (-$61 million)
  • Mining – $69.2 million (-$43 million)
  • Financial and Insurance Services – $736 million (-$21 million)
  • Information Media and Telecommunications – $369 million (-$12 million)
  • Education and Training – $1.15 billion (-$5 million)

Manufacturing is the city’s biggest exporter with a value of $1.3 billion. Food Manufacturing, Primary Metal and Metal Product Manufacturing, Fabricated Metal Product Manufacturing, and Polymer Product and Rubber Product Manufacturing make up the majority of this industry.

Employment

The top employing industries as at June 2022

  • Health Care and Social Assistance – 20,427 jobs (+2,462 from 2020/21)
  • Construction – 20,191 jobs (+1,254)
  • Retail Trade – 14,544 jobs (+844)
  • Education and Training – 12,492 jobs (+784)

Local Jobs

There were 120,268 jobs located in the City of Logan in the year ending June 2022. This represents a 5.79% increase from 113,684 jobs at June 2021.

Logan has recorded strong local jobs growth of 8.6% from June 2017 to June 2022. Although jobs growth stalled between 2019 and 2021, there was a good recovery, with financial year 2021/22 having the largest growth in local jobs in the last 25 years and above the Queensland growth rate of 4.7%.

Year (ending 30 June) Local jobs % change from previous year
2022 120,268 +5.79
2021 113,684 +2.20
2020 111,233 -1.37
2019 112,782 +1.80
2018 110,790 +5.15

The 2021 Census data showed that for the 102,853 local jobs in the city, 59% of those were occupied by Logan residents. The other 41% of workers live in other Council areas and commute into the city for work. Main residential locations include Brisbane (20.4%), Gold Coast (8.7%), Redland (4.2%) and Ipswich (3.6%).

Local workers

Of the 151,633 employed Logan residents in the 2021 Census data, 40% live and work in the City of Logan, 54.1% travel outside the city for work, and 5.9% have no fixed place of work. Brisbane was the main employment centre, with 57,120 (37.7%) Logan residents travelling to the Brisbane Council area for work.

Unemployment (Dec 2022 data)

The unemployment rate has been trending downwards since September 2021 and is 6.5% for the December 2022 quarter. It is at its lowest rate since September 2017.

Unemployment Rate % Change in % points
Period: Quarter Dec 21 Mar 22 Jun 22 Sep 22 Dec 22 Dec 21 to Dec 22
Australia 5.1 4.6 4.3 4.0 3.7 -1.4
Queensland 5.5 4.9 4.5 4.2 3.9 -1.6
Brisbane 5.0 4.3 3.8 3.4 3.2 -1.8
Gold Coast 4.8 4.4 3.9 3.4 2.9 -1.9
Moreton Bay 5.7 5.0 5.1 4.5 4.1 -1.6
Redland 4.2 3.1 2.7 2.3 2.3 1.9
Ipswich 7.8 6.7 6.3 6.4 6.4 -1.4
City of Logan 8.7 7.7 7.1 6.8 6.5 -2.2

Areas with the lowest unemployment rate

  • Shailer Park – 2.1%
  • Cornubia – Carbrook – 2.2%
  • Rochdale South – Priestdale – 3%
  • Greenbank – 3%
  • Daisy Hill – 3%
  • Wolffedene – Bahrs Scrub – 3%
  • Munruben – Park Ridge South – 3.1%

Areas with the highest unemployment rate

  • Logan Central – 22.9%
  • Kingston – 16%
  • Loganlea – 11.7%
  • Beenleigh – 11.5%
  • Eagleby – 11%

Areas with most improved unemployment rate over the last 12 months

  • Shailer Park (3.5% to 2.1%) -40%
  • Mount Warren Park (7.8% to 5.1%) -35%
  • Wolffedene – Bahrs Scrub (4.5% to 3%) -33%
  • Hillcrest (6.2% to 4.2%) -32%
  • Bethania – Waterford (8.5% to 5.8%) -32%

Local Businesses

There was a net increase of 2,031 local businesses from June 2021 to June 2022. The highest amount of new businesses were in the Construction, Transport, Postal and Warehousing, and Administrative and Support Services Industries.

Number of businesses by turnover

  • Zero to less than $50k – 6,607
  • $50k to less than $200k – 8,047
  • $200k to less than $2m – 7,328
  • $2m to less than $5m – 845
  • $5m to less than $10m – 297
  • $10m or more – 275

Population

The Estimated Resident Population of the City of Logan is 363,301 as at June 2022. This is a 3.53% increase since 2020/21 and makes Logan the second-fastest growing LGA in Queensland. The 5-year average growth is 2.6%.

Net migration to the city has been the highest from Brisbane (+3,793), followed by Gold Coast, Townsville and Blacktown (NSW). Net migration loses have been to Ipswich (-1,166), Sunshine Coast, Moreton Bay, Lockyer Valley and Fraser Coast.

Estimated population growth is highest in the following SA2 areas

  • Chambers Flat – Logan Reserve – +18.9%
  • Greenbank – North Maclean – +13.2%
  • Wolffdene – Bahrs Scrub – +12.9%
  • Yarrabilba – +12.2%
  • Boronia Heights – Park Ridge – +11.7

Development Activity Highlights

  • New non-residential development approvals continue to grow, with 272,797m² of new non-residential Gross Floor Area (GFA) space approved for 2021/2022 (excludes mixed use).
  • The biggest increases in non-residential growth occurred in Low Impact Industry, with 37,172m² of new floor space (GFA) approved.
  • Estimated value of new non-residential work of $482,350,355 (excludes mixed-use, demolitions, alterations and fit-outs).
  • Over 4,500 new dwellings have been added to the city’s housing stock (130,109 as at June 2022). Of these additional dwellings, the most popular dwelling type was a stand-alone house, followed by a house with a secondary dwelling/auxiliary unit.
  • Logan is on track to deliver our dwelling number targets that are set by the State Government’s SEQ Regional Plan. As at June 2022 the city has 130,109 dwellings moving towards 198,670 by 2041.
    Note: New dwelling targets are currently being considered as part of an ShapingSEQ review, and are likely to change in the near future.

ShapingSEQ dwelling targets

Top 5 suburbs for residential dwelling approvals were

  • Logan Reserve – 811
  • Park Ridge – 506
  • Greenbank – 465
  • Yarrabilba – 204
  • Flagstone – 177

Census Comparison Data

To see changes to the City of Logan’s demographic data from the 2016 Census to the 2021 Census, see our fact sheet.