Latest economic data shows continued growth trajectory for Logan
Logan City Council collects key economic statistics and information to measure how the city is performing. This information has been compiled into the 2026 Economic Update. Most of the data is from the 2024/25 reporting period (to end-June 2025), but is noted if the data set contains data from different time periods. Data sources can be found within the document.
View the City of Logan Economic Update 2026
Key Economic Indicators
$20.62b
137,224
199,305
4.5%
403,515
29,449
3,467
$2.9b
$10.75b
A $20.6 billion economy and growing
Logan’s economy expanded by 4.9 per cent during 2024/25, taking total Gross Regional Product (GRP) to $20.62 billion. Over the past five years, Logan has averaged annual growth of 5.3 per cent, making it one of the fastest-growing economies in South East Queensland.
Logan’s economic profile continues to diversify. While construction and health care remain foundational industries, increased activity in logistics, wholesale trade and retail reflects the city’s growing role as a major distribution and consumer market within South East Queensland.
The strong performance of warehousing and logistics also aligns with significant industrial investment occurring across Logan’s major employment precincts.
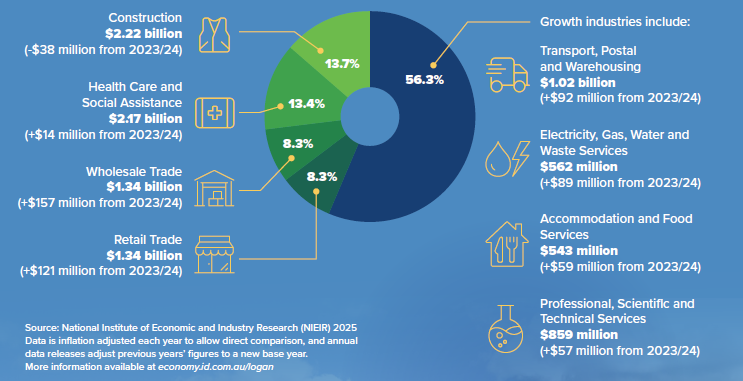
The top 4 industries who contribute most to Logan’s economy continue to be
- Construction – $2.22 billion (-$38m)
- Health Care and Social Assistance – $2.17 billion (+$14m)
- Wholesale Trade – $1.34 billion (+$157m)
- Retail Trade – $1.34 billion (+$121m)
Additional growth industries included
- Transport, Postal and Warehousing (+$92m from 2023/24)
- Electricity, Gas, Water and Waste Services (+$89m)
- Accommodation and Food Services (+59m)
- Professional, Scientific and Technical Services (+$57m)
Logan’s Gross Regional Product (GRP)
| Year (ending 30 June) | GRP ($m) | % change from previous year |
|---|---|---|
| 2025 | 20,623 | 4.92 |
| 2024 | 19,655 | 3.76 |
| 2023 | 18,943 | 4.18 |
| 2022 | 18,183 | 6.44 |
| 2021 | 17,082 | 7.23 |
| 2020 | 15,931 | -0.81 |
Top value-adding industries
Employment growth creates more local opportunities
Logan had 137,224 local jobs in 2024/25, up 3.7 per cent on the previous year and 24 per cent higher than four years ago. At the same time, employed residents increased to 199,305.
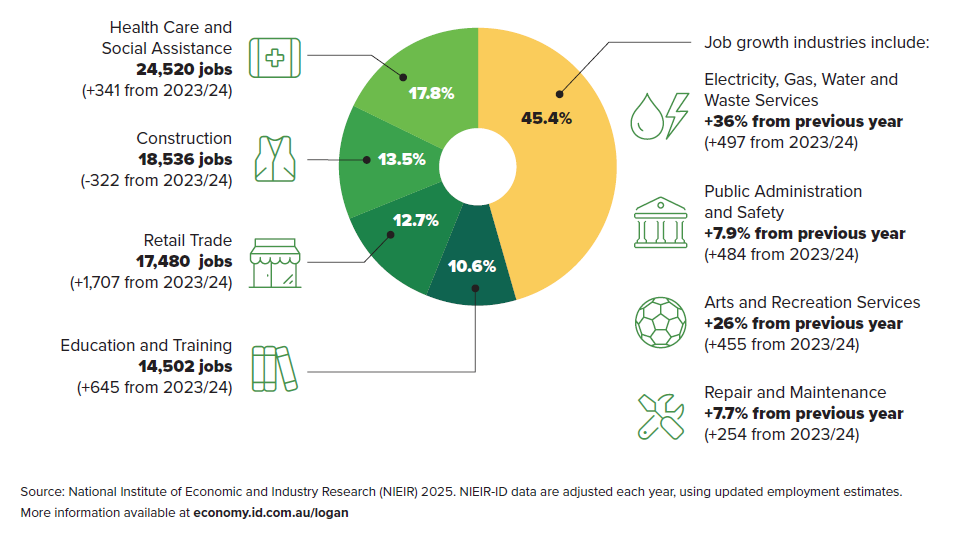
Health Care and Social Assistance remains the city’s largest employer with 24,520 jobs, followed by Construction (18,536), Retail Trade (17,480) and Education and Training (14,502).
Importantly, Logan’s jobs growth has exceeded population growth over the past five years, resulting in the highest jobs-to-population ratio in more than 15 years.
Unemployment Remains Below 5%
Logan’s unemployment rate fell from 5.4% in December 2024 to 4.5% in December 2025, reaching a low of 4.3% during September 2025. The city maintained unemployment below five per cent throughout 2025.
While youth unemployment remains elevated at 13.6% (rate for Logan-Beaudesert SA4 at April 2026), ongoing business investment and job creation will continue to be critical in improving outcomes for younger residents.
Population growth among the strongest in Queensland
Logan’s population reached 403,515 residents in June 2025, increasing by 11,949 residents during the year. This represents annual growth of 3.1 per cent, making Logan the second fastest-growing local government area in Queensland.
Estimated Resident Population
| ERP at 30 June | ERP Change | Components of population change 2024–25 | |||||
| LGA name | 2024 | 2025 | no. | % | Natural increase no. | Net internal migration no. | Net overseas migration no. |
| Brisbane | 1,353,837 | 1,375,301 | 21,464 | 1.6 | 4,983 | -7,203 | 23,684 |
| Gold Coast | 679,286 | 691,230 | 11,944 | 1.8 | 2,300 | 658 | 8,986 |
| Ipswich | 259,134 | 268,272 | 9,138 | 3.5 | 2,520 | 4,893 | 1,725 |
| Logan | 391,566 | 403,515 | 11,949 | 3.1 | 3,532 | 5,105 | 3,312 |
| Moreton Bay | 521,494 | 532,445 | 10,951 | 2.1 | 1,934 | 5,195 | 3,822 |
| Redland | 169,940 | 172,831 | 2,891 | 1.7 | 171 | 1,600 | 1,120 |
| Scenic Rim | 45,944 | 46,947 | 1,003 | 2.2 | 0 | 818 | 185 |
| Sunshine Coast | 374,298 | 381,957 | 7,659 | 2.0 | 580 | 4,159 | 2,920 |
| Toowoomba | 184,075 | 186,276 | 2,201 | 1.2 | 620 | 564 | 1,017 |
| Total Queensland | 5,571,890 | 5,669,764 | 97,874 | 1.8 | 20,606 | 21,595 | 55,673 |
The city recorded:
- 3,532 people through natural increase
- 5,105 people from net internal migration
- 3,312 people from net overseas migration
Five of Queensland’s ten fastest-growing SA2 regions are located in Logan:
- Greenbank–North Maclean (+14.2%)
- Chambers Flat–Logan Reserve (+12.0%)
- Yarrabilba (+8.4%)
- Flagstone (West)–New Beith (+8.1%)
- Wolffdene–Bahrs Scrub (+6.6%)
Few cities in Australia are experiencing the combination of sustained migration, high natural increase and strong employment growth seen in Logan. The data reinforces Logan’s position as one of the nation’s fastest-growing family cities and highlights the ongoing demand for housing, services and infrastructure.
Businesses Continue to Choose Logan
There was a net increase of 1,638 local businesses from June 2024 to June 2025, to 29,449 businesses. The highest amount of new businesses were in the Transport, Postal and Warehousing, Construction, and Healthcare and Social Assistance industries.
Business growth is occurring in sectors closely aligned with Logan’s competitive advantages—industrial land availability, strategic freight access, population growth and a growing consumer market. The continued rise in small businesses also highlights strong entrepreneurial activity across the city.
97.6% of businesses in Logan are sole traders or small businesses (less than 20 employees).
| Business size | No. of businesses | Change from previous year | |
| Non employing | 18,481 | +1,349 | +7.9% |
| 1-4 employees | 7,858 | +249 | +3.3% |
| 5-19 employees | 2,418 | +18 | +0.8% |
| 20-199 employees | 669 | +22 | +3.4% |
| 200+ employees | 23 | - | - |
Housing demand and macroeconomic factors continue to drive prices higher
The median house price in Logan reached $890,000 in January 2026, up 16.2 per cent over the year and double the median value recorded in 2021. Median units increased to $610,000.
| Dwelling Prices | Rental Prices (per week) | |||
| Year (Jan) | Median House | Median Unit | Median House | Median Unit |
| 2026 | $890,000 | $610,000 | $630 | $500 |
| 2025 | $766,000 | $500,000 | $590 | $460 |
| 2024 | $663,000 | $380,000 | $550 | $415 |
| 2023 | $615,000 | $330,000 | $500 | $350 |
| 2022 | $520,000 | $265,000 | $420 | $315 |
| 2021 | $445,000 | $225,000 | $380 | $300 |
Rental prices also continued to rise:
- Houses: $630 per week (+6.8%)
- Units: $500 per week (+8.7%)
Top land sales locations included:
- Greenbank (310)
- Park Ridge (274)
- Yarrabilba (201)
- Flagstone (170)
- Logan Reserve (152)
Strong resident and visitor consumer spending
Consumer spending growth highlights rising household confidence and population-driven demand. The leakage data also identifies significant opportunities for future retail investment and expansion within Logan.
The fastest-growing resident spending categories in 2025 included:
- Tourism and Entertainment – $1.45b (+11.2%)
- Household spending – $1.86b (+10.9%)
- Discretionary Retail – $2.47b (+8.3%)
Top leakage sub-categories (resident spending in other Council areas) included:
- Other Discretionary Retail – $266m (+6.1%)
*Other Discretionary Retail includes – Electronics Stores, Hardware, Motor Vehicles & Accessories, Personal Goods Retailing, Pharmacies, Gardening Stores & Nurseries - Supermarkets – $253m (+6.6%)
- Department Stores, Clothing and Accessories – $212m (+7.2%)
- Takeaway and Fast Food Outlets – $133m (+7.0%)
Tourism a strong contributor to Logan’s economy
Tourism now contributes $971 million annually to Logan’s economy and supports 10,351 jobs. In 2025 Logan welcomed:
- 3.35 million domestic day trips
- $503 million Day Trip spend
- 906,000 domestic overnight trips
- 44,600 international visitors (three-year average)
Visitor spending reached approximately $1.5 billion, with strong growth in tourism and entertainment expenditure. Tourism’s growing contribution demonstrates the increasing importance of visitor-related industries across hospitality, food, entertainment and events. With one in 13 local jobs now tourism-related, the sector is becoming an increasingly important economic driver.
Development activity highlights
- $2 billion estimated construction value of Building Completions in 2024/25, down 10% from $2.23 billion in 2023/24.
- 197,002m² new non-residential Gross Floor Area (GFA) space completed in 2024/25 down 57% from 346,618m2 in 2023/24.
- 76,048m² new floor space (GFA) for Warehouse, Distribution & Logistics, the biggest increase in non-residential growth.
- $3.43 billion estimated construction value of all new Building Approvals for 2024/25. up 8% from $2.29 billion in 2023/24.
- $312,321,090 estimated construction value of new non-residential work (based on Building Approvals – excludes mixed-use, demolitions, alterations and fit-outs), (down 30% from $450,245,777 in 2023/24).
-
3,211 net new dwellings added to the city’s housing stock in 2024/25. This is a decrease from 4,364 dwellings added in 2023/24. Of these additional dwellings, the most popular dwelling type was a stand-alone house, followed by a house with a secondary dwelling/auxiliary unit.
- Top 5 suburbs for residential dwelling completions were:
- Greenbank – 486
- Yarrabilba – 463
- Logan Reserve – 376
- Park Ridge – 342
- Flagstone – 325
- $416,766 median construction cost for a stand-alone house, up from $370,336 in 2023/24.
- 188 business days The average construction timeframes for residential dwellings from approval to completion in 2024/25 which is a decrease from 210 days in 2023/24.
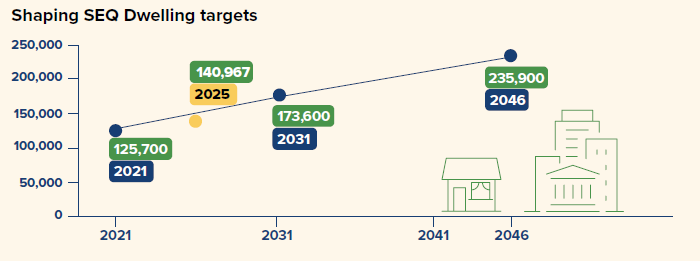
- 140,967 dwellings
ShapingSEQ 2023 targets state that the City of Logan is required to accommodate an additional 110,200 dwellings from 2021 to 2046. By June 2025, 140,967 residential dwellings were recorded in Logan with a growth of 15,267 dwellings from 2021. Based on these updated figures, Logan is required to now facilitate an additional 94,933 residential dwellings by 2046 (approx. 4,521 dwellings per year).