Global heavy equipment supplier Porter Group has officially opened its new Australian headquarters in Berrinba, marking a major milestone in the company’s long‑term commitment to Australia’s mining, quarrying and heavy infrastructure sectors.

The relocation from Archerfield to a purpose‑built 35,000‑square‑metre facility on Arshad Drive, Berrinba, represents an investment of more than $40 million and reflects the company’s confidence in continued growth across the resources and heavy industry markets.

Speaking at the official opening on April 23, Porter Group Australia and New Zealand Chief Operating Officer Darren Ralph said the establishment of the new facility represents both a celebration of growth and a foundation for the future.

“This new headquarters is more than just a building – it reflects our long‑term commitment to the Australian market and our focus on delivering outstanding service and solutions across the country,” Mr Ralph said.

“Established in Australia in 2003, we’ve grown from modest beginnings in Brisbane to a national operation. This facility recognises how far we have come and sets the foundation for where we’re heading next.”

Mr Ralph also acknowledged the legacy of Porter Group founder Arthur Porter, and the late Mark Porter, who helped establish the Australian business.
“His legacy lives on in what we celebrate today,” Mr Ralph said.

Porter Group is a privately owned, family‑founded business supplying world‑leading heavy equipment brands across New Zealand, Australia, Papua New Guinea and the United States through both sales and rental solutions.

Established in 1945 by the late Arthur Porter, the company initially delivered civil construction and road‑building projects in New Zealand before expanding into machinery and parts distribution. Today, Porter Group operates more than 50 locations and is recognised as one of the largest privately owned heavy equipment providers in Australia and New Zealand.

“While we’ve grown significantly over the decades, our focus has remained consistent,” said Kendrah Worsley, Group Marketing Manager (NZ & Australia). “We’re committed to delivering premium equipment backed by strong service and long‑term customer support, particularly in high‑utilisation industries like mining and infrastructure.”

Purpose‑built to support growth

The Berrinba site was strategically selected to support the continued growth of Porter Group’s Australian operations. As demand for equipment, servicing and parts support increases, the larger purpose‑built facility enables the business to scale while maintaining service performance.

“The size and layout of this site allow us to do more,” Ms Worsley said. “We’ve increased workshop capacity, improved parts storage and now have the ability to hold a wider range of machines on site. This directly improves turnaround times and customer support.”

While job creation was not the primary driver of the relocation, the expanded facility strengthens Porter Group’s ability to support its existing workforce of approximately 60 to 80 staff and operate more efficiently as demand grows.

Strategic location in a growing logistics hub

Porter Group’s relocation places the company within one of Queensland’s fastest‑growing logistics and industrial regions, alongside major operators including Amazon, DHL Supply Chain and Toyota.

This concentration of major investment continues to reinforce Logan’s reputation as a critical supply‑chain hub supporting freight, logistics and industrial activity across South East Queensland.

“Logan offered the connectivity and industrial scale we need for our next phase of growth,” Ms Worsley said. “Being located directly off the Logan Motorway gives us faster access to customers, improved visibility and more efficient delivery to project sites.”

Centrally positioned between Brisbane and the Gold Coast, Logan’s access to major transport corridors makes it an increasingly strategic base for businesses servicing mining and heavy industry operations.

Members of Porter Group with Mayor Jon Raven, Councillor Stemp and Jackson, and LOED staff

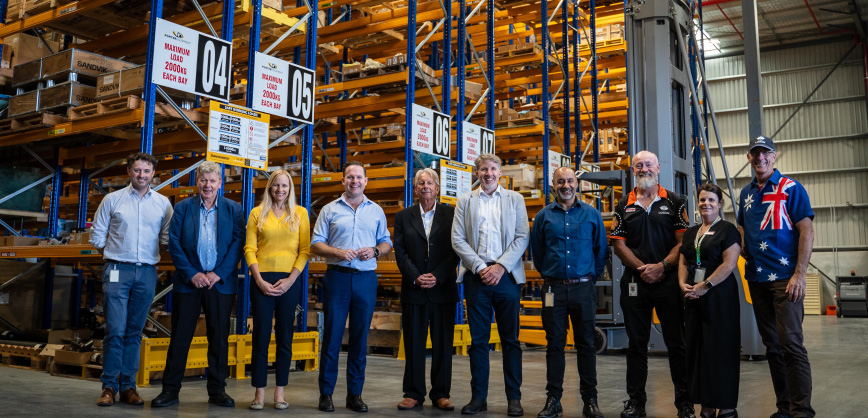
Members of Porter Group with Mayor Jon Raven, Councillor Stemp, Councillor Jackson, and LOED staff

More than machinery

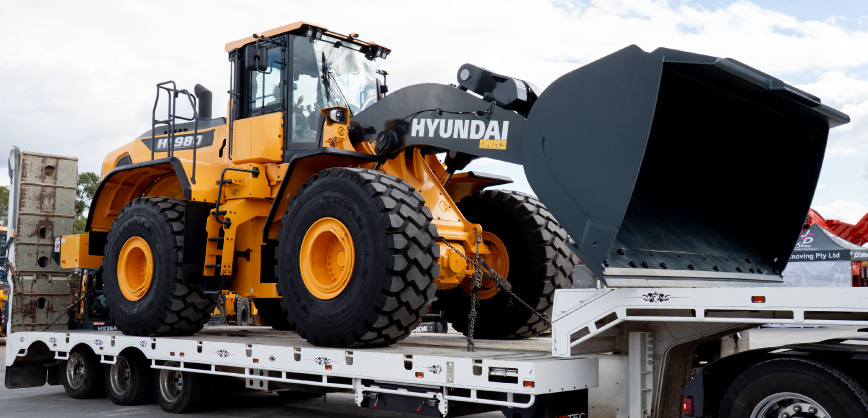
While Porter Group is the exclusive distributor of Hyundai Construction Equipment, Ms Worsley said the company’s competitive advantage lies in its aftersales support.

“Our point of difference isn’t just the equipment,” she said. “It’s our responsiveness, our experienced service teams and strong parts availability. Whether customers are running small fleets or large mining operations, we focus on keeping machines operating.”

The new facility also enhances Porter Group’s ability to support smarter fleet management through telematics systems that provide real‑time insight into performance, fuel use and maintenance requirements.

With its Logan headquarters now operational, Porter Group is well positioned to support Australia’s growing resources and infrastructure industries from the centre of one of Queensland’s most dynamic industrial corridors.

Heavy machinery

Logan continues to be one of the fastest growing cities in Queensland following the release of updated population data.

The latest Estimated Resident Population figure has been released this month, with a measure from 30 June 2025. The Estimated Resident Population (ERP) is the official population of the area. It is updated annually by the Australian Bureau of Statistics, and reassessed every Census.

City of Logan Estimated Resident Population (ERP) – June 2025 – 403,515

Increase of 11,949 people from June 2024 to June 2025, or 3.1%

  • Logan had the 2nd highest population growth as a total amount of people in the state behind Brisbane (driven by high natural growth rate and internal migration)
  • Logan is the 2nd fastest-growing LGA in the state (behind Ipswich who had a growth rate of 3.5%)

Population by LGA June 25

ERP at 30 June ERP Change Components of population change 2024–25
LGA name 2024 2025 no. % Natural increase no. Net internal migration no. Net overseas migration no.
Brisbane 1,353,837 1,375,301 21,464 1.6 4,983 -7,203 23,684
Gold Coast 679,286 691,230 11,944 1.8 2,300 658 8,986
Ipswich 259,134 268,272 9,138 3.5 2,520 4,893 1,725
Logan 391,566 403,515 11,949 3.1 3,532 5,105 3,312
Moreton Bay 521,494 532,445 10,951 2.1 1,934 5,195 3,822
Redland 169,940 172,831 2,891 1.7 171 1,600 1,120
Scenic Rim 45,944 46,947 1,003 2.2 0 818 185
Sunshine Coast 374,298 381,957 7,659 2.0 580 4,159 2,920
Toowoomba 184,075 186,276 2,201 1.2 620 564 1,017
Total Queensland 5,571,890 5,669,764 97,874 1.8 20,606 21,595 55,673

5 of the Top 10 fastest-growing regions (SA2’s) in Queensland are in Logan

SA2 name ERP June 2024 no. ERP June 2025 no. Change 2024–25 no. Change 2024–25 %
Ripley 20,328 23,459 3,131 15.4
Morayfield 6,812 7,826 1,014 14.9
Greenbank - North Maclean 11,115 12,691 1,576 14.2
Chambers Flat - Logan Reserve 15,063 16,875 1,812 12.0
Eagle Farm - Pinkenba 2,500 2,746 246 9.8
Caloundra West - Baringa 21,892 23,872 1,980 9.0
Yarrabilba 14,575 15,803 1,228 8.4
Flagstone (West) - New Beith 12,357 13,360 1,003 8.1
Pallara - Willawong 15,439 16,586 1,147 7.4
Wolffdene - Bahrs Scrub 11,979 12,765 786 6.6

Other notable points

  • Logan had the 4th highest level of overseas migration behind Brisbane, Gold Coast and Moreton Bay
  • Logan had the 2nd highest level of internal migration behind Moreton Bay (Brisbane had negative internal migration that was made-up for by natural growth and overseas migration)
  • Logan has the 3rd highest population density (421 persons/km) behind Brisbane (1024) and Gold Coast (518)

Growth has moderated across the board, with all locations in South East Queensland experiencing lower growth figures compared to 2023/24

chart showing population growth percentages for Loga, Queensland and Australia, peaking in 2023

Delivery of dwellings in the city follows a similar trend to population, with dwelling delivery cooling off from the peak in 2023/24.

For the financial year to June 2025, 3,467 dwellings were completed in the City of Logan.

Building Completions 2016/2017 to 2025/26 (Part year 2025/26 to Feb 2026)

Financial Year Total new dwellings Total dwellings demolished Total net new dwellings
FY 16/17                                                                                                     3,073                                                   37                                                        3,036
FY 17/18                                                                                                     3,314                                                   86                                                        3,228
FY 18/19                                                                                                     3,921                                                   74                                                        3,847
FY 19/20                                                                                                     3,144                                                 111                                                        3,033
FY 20/21                                                                                                     2,694                                                   94                                                        2,600
FY 21/22                                                                                                     3,651                                                 114                                                        3,537
FY 22/23                                                                                                     4,299                                                 119                                                        4,180
FY 23/24                                                                                                     4,573                                                 213                                                        4,360
FY 24/25                                                                                                     3,467                                                 256                                                        3,211
FY 25/26 (Part)                                                                                                     2,312                                                 115                                                        2,197

Chart showing dwelling completions as details in above chart

The main development fronts reflect the top 5 growing areas in the city

  • Greenbank – 486
  • Yarrabilba – 463
  • Logan Reserve – 376
  • Park Ridge – 342
  • Flagstone – 325

In terms of Building Approvals in 2024/25, 4,024 dwellings were approved in the City of Logan.

Building Approvals 2016/17 to 2025/26 (Part year 2025/26 to Feb 2026)

Financial Year Total new dwellings Total dwellings demolished Total net new dwellings
FY 16/17                                        3,481                                 81                                   3,400
FY 17/18                                        4,167                              132                                   4,035
FY 18/19                                        3,693                              129                                   3,564
FY 19/20                                        2,857                              141                                   2,716
FY 20/21                                        4,820                              198                                   4,622
FY 21/22                                        4,620                              174                                   4,446
FY 22/23                                        4,357                              242                                   4,115
FY 23/24                                        3,942                              279                                   3,663
FY 24/25                                        4,024                              231                                   3,793
FY 25/26 (Part)                                        2,974                              157                                   2,817

According to ABS Dwelling Approval data, for the current financial year (July 2025 to February 2026) Logan has the 2nd-highest amount of housing approvals in the state behind Moreton Bay.

Further breakdown of population and dwelling data will be provided in the annual Economic Update, due in June 2026.