Logan’s strong population growth continues
Logan continues to be one of the fastest growing cities in Queensland following the release of updated population data.
The latest Estimated Resident Population figure has been released this month, with a measure from 30 June 2025. The Estimated Resident Population (ERP) is the official population of the area. It is updated annually by the Australian Bureau of Statistics, and reassessed every Census.
City of Logan Estimated Resident Population (ERP) – June 2025 – 403,515
Increase of 11,949 people from June 2024 to June 2025, or 3.1%
- Logan had the 2nd highest population growth as a total amount of people in the state behind Brisbane (driven by high natural growth rate and internal migration)
- Logan is the 2nd fastest-growing LGA in the state (behind Ipswich who had a growth rate of 3.5%)
Population by LGA June 25
| ERP at 30 June | ERP Change | Components of population change 2024–25 | |||||
| LGA name | 2024 | 2025 | no. | % | Natural increase no. | Net internal migration no. | Net overseas migration no. |
| Brisbane | 1,353,837 | 1,375,301 | 21,464 | 1.6 | 4,983 | -7,203 | 23,684 |
| Gold Coast | 679,286 | 691,230 | 11,944 | 1.8 | 2,300 | 658 | 8,986 |
| Ipswich | 259,134 | 268,272 | 9,138 | 3.5 | 2,520 | 4,893 | 1,725 |
| Logan | 391,566 | 403,515 | 11,949 | 3.1 | 3,532 | 5,105 | 3,312 |
| Moreton Bay | 521,494 | 532,445 | 10,951 | 2.1 | 1,934 | 5,195 | 3,822 |
| Redland | 169,940 | 172,831 | 2,891 | 1.7 | 171 | 1,600 | 1,120 |
| Scenic Rim | 45,944 | 46,947 | 1,003 | 2.2 | 0 | 818 | 185 |
| Sunshine Coast | 374,298 | 381,957 | 7,659 | 2.0 | 580 | 4,159 | 2,920 |
| Toowoomba | 184,075 | 186,276 | 2,201 | 1.2 | 620 | 564 | 1,017 |
| Total Queensland | 5,571,890 | 5,669,764 | 97,874 | 1.8 | 20,606 | 21,595 | 55,673 |
5 of the Top 10 fastest-growing regions (SA2’s) in Queensland are in Logan
| SA2 name | ERP June 2024 no. | ERP June 2025 no. | Change 2024–25 no. | Change 2024–25 % |
| Ripley | 20,328 | 23,459 | 3,131 | 15.4 |
| Morayfield | 6,812 | 7,826 | 1,014 | 14.9 |
| Greenbank - North Maclean | 11,115 | 12,691 | 1,576 | 14.2 |
| Chambers Flat - Logan Reserve | 15,063 | 16,875 | 1,812 | 12.0 |
| Eagle Farm - Pinkenba | 2,500 | 2,746 | 246 | 9.8 |
| Caloundra West - Baringa | 21,892 | 23,872 | 1,980 | 9.0 |
| Yarrabilba | 14,575 | 15,803 | 1,228 | 8.4 |
| Flagstone (West) - New Beith | 12,357 | 13,360 | 1,003 | 8.1 |
| Pallara - Willawong | 15,439 | 16,586 | 1,147 | 7.4 |
| Wolffdene - Bahrs Scrub | 11,979 | 12,765 | 786 | 6.6 |
Other notable points
- Logan had the 4th highest level of overseas migration behind Brisbane, Gold Coast and Moreton Bay
- Logan had the 2nd highest level of internal migration behind Moreton Bay (Brisbane had negative internal migration that was made-up for by natural growth and overseas migration)
- Logan has the 3rd highest population density (421 persons/km) behind Brisbane (1024) and Gold Coast (518)
Growth has moderated across the board, with all locations in South East Queensland experiencing lower growth figures compared to 2023/24

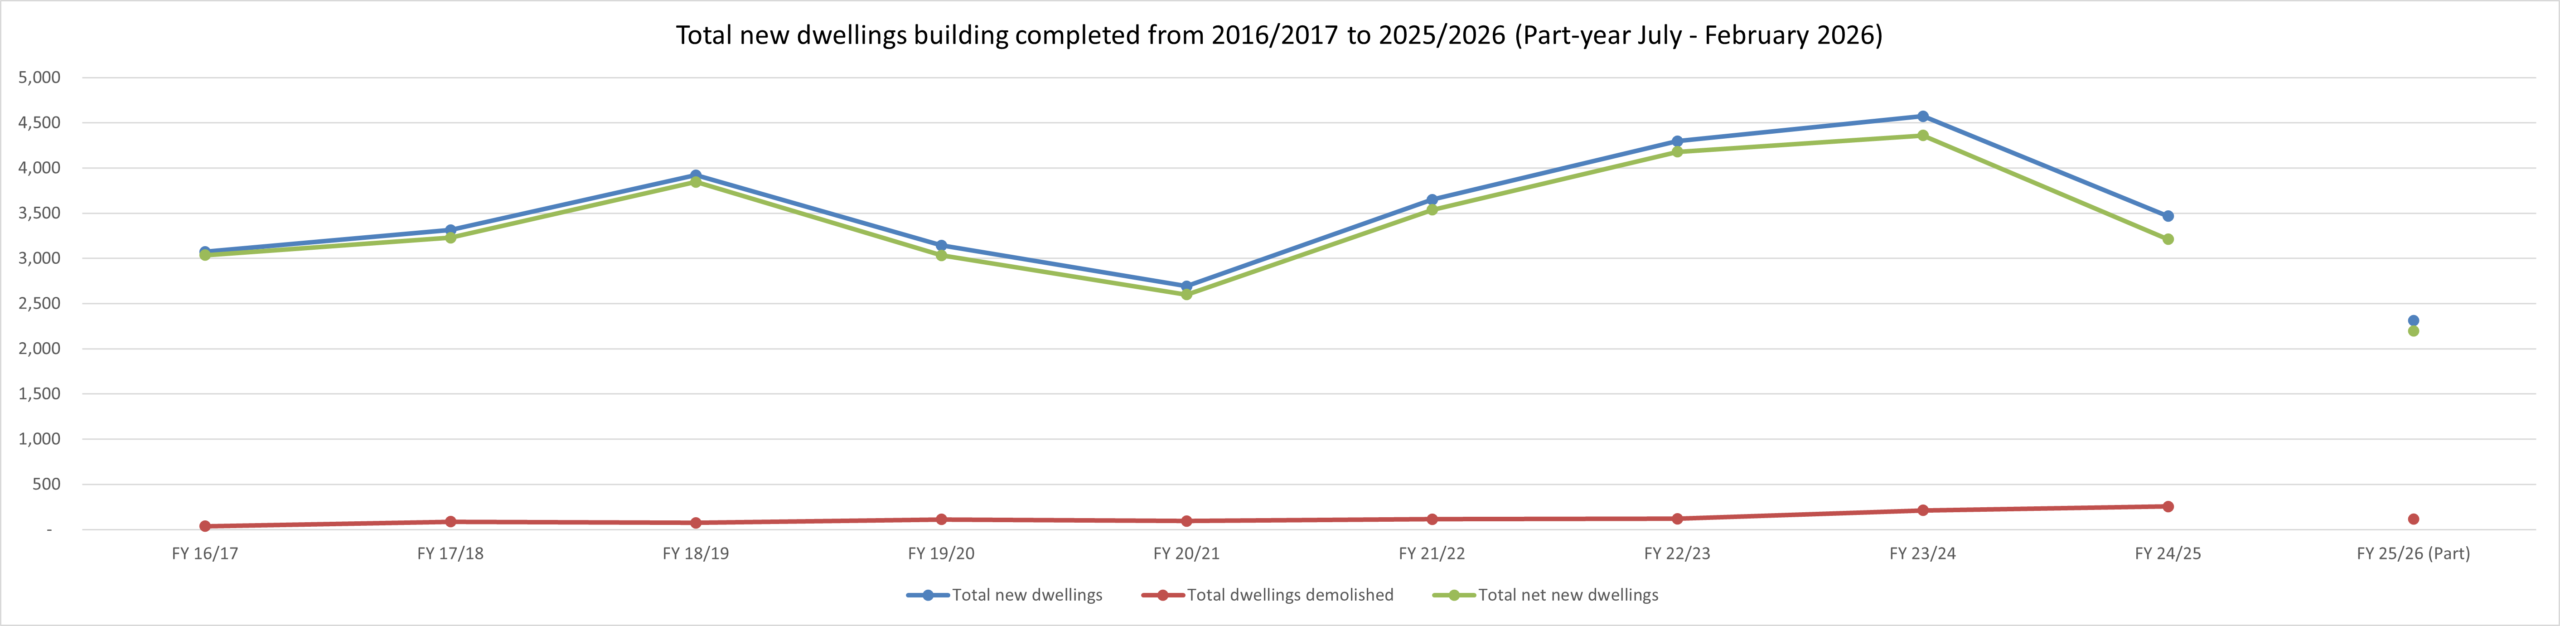
Delivery of dwellings in the city follows a similar trend to population, with dwelling delivery cooling off from the peak in 2023/24.
For the financial year to June 2025, 3,467 dwellings were completed in the City of Logan.
Building Completions 2016/2017 to 2025/26 (Part year 2025/26 to Feb 2026)
| Financial Year | Total new dwellings | Total dwellings demolished | Total net new dwellings |
| FY 16/17 | 3,073 | 37 | 3,036 |
| FY 17/18 | 3,314 | 86 | 3,228 |
| FY 18/19 | 3,921 | 74 | 3,847 |
| FY 19/20 | 3,144 | 111 | 3,033 |
| FY 20/21 | 2,694 | 94 | 2,600 |
| FY 21/22 | 3,651 | 114 | 3,537 |
| FY 22/23 | 4,299 | 119 | 4,180 |
| FY 23/24 | 4,573 | 213 | 4,360 |
| FY 24/25 | 3,467 | 256 | 3,211 |
| FY 25/26 (Part) | 2,312 | 115 | 2,197 |
The main development fronts reflect the top 5 growing areas in the city
- Greenbank – 486
- Yarrabilba – 463
- Logan Reserve – 376
- Park Ridge – 342
- Flagstone – 325
In terms of Building Approvals in 2024/25, 4,024 dwellings were approved in the City of Logan.
Building Approvals 2016/17 to 2025/26 (Part year 2025/26 to Feb 2026)
| Financial Year | Total new dwellings | Total dwellings demolished | Total net new dwellings |
| FY 16/17 | 3,481 | 81 | 3,400 |
| FY 17/18 | 4,167 | 132 | 4,035 |
| FY 18/19 | 3,693 | 129 | 3,564 |
| FY 19/20 | 2,857 | 141 | 2,716 |
| FY 20/21 | 4,820 | 198 | 4,622 |
| FY 21/22 | 4,620 | 174 | 4,446 |
| FY 22/23 | 4,357 | 242 | 4,115 |
| FY 23/24 | 3,942 | 279 | 3,663 |
| FY 24/25 | 4,024 | 231 | 3,793 |
| FY 25/26 (Part) | 2,974 | 157 | 2,817 |

According to ABS Dwelling Approval data, for the current financial year (July 2025 to February 2026) Logan has the 2nd-highest amount of housing approvals in the state behind Moreton Bay.
Further breakdown of population and dwelling data will be provided in the annual Economic Update, due in June 2026.


